simulation

Springs simulation

DiScoro writes about inquiry-based learning, digital resources, and ways to encourage higher-order thinking. We focus on STEM education and the use of technology.

PHET has an interesting new simulation for primary school Masses and Springs. An easy to use simulation where pupils can investigate weights (mass) using springs. The program has three levels: Stretch, Bounce and Lab.

Stretch
The first challenge is to find out what ‘Spring strength’ actually means. The next task is to use it to find out the mass of the unknown weights. Pay attention to the availability of a ruler.
Instruct pupils check out all the options/buttons that are available on the screen. Many oversee some of them that come in handy in the next level.

Bounce
Some additional tools have been added. Lines for ‘resting position’ and ‘movable line’ and a stopwatch (chronometer). Estimate the mass of the three unknown weights again. How can you find this out using the chronometer? How does mass influence the bouncing of a spring? How does the spring strenghts influence the bouncing of the spring?

Lab
The last level is more suitable for secondary school students. Terms like ‘velocity’, ‘acceleration’ and ‘period trace’ are quite complex.  To explain how different values are related and to describe cause and effect using these concepts is quite a challenge.

More PHET simulations. See also Chemistry: pH scales and acidity Balancing Act, The moving man, Energy skate park, and Density and Buoyancy.

 Purchase  Free
 Hardware  PC; iPad
 Requirements  browser (HTML5 is used)

Chemistry: pH scales and acidity

The PHET simulation pH Scales enables students to experiment with acidic and basic fluids.

Note that pH scale and acidity are complex concepts for students especially for primary school pupils. A lower pH value means more ‘acidic’ and a higher value means less acidic, or more ‘basic’.  Neutral is indicated by the pH value 7.0.

However, the simulation can help the students to familiarize themselves with the concept(s). The simulation can be used in grade 6 or 7. Depending on how much time you wish to spend and how much structure you wish to give, in addition to the simulation, you could encourage the students to experiment and discover the basics about pH values in fluids and its application in every day life.

Suggestions for tasks and experiments:

  1. Check out the different fluids available.
    Rank the fluids from most basic to most acidic before you start measuring. Write down your estimation.
  2. Measure the pH values for the fluids given and write the results in a table.
    Which fluids are closest to pH 7.0?
    What does it mean if  the pH value of a fluid is close to 7.0?
  3. Use water to dillute the fluids and try to make a fluid that is closest to 7.0.
    Write down what you have done to reach your result.
    Make a screencast of your closest result(s) and print it out.
  4. Can you dillute a basic fluid with water to a pH value below 7.0?
    Can you dillute an acid fluid with water to a pH value above 7.0?
    Try to explain the result?

Think beyond the simulation.

  1. How could you make an acidic fluid basic? In other words, how could you for example change the pH value of an acidic fluid from 5.0 to 7.5?
  2. a. Your body functions best if the pH value is neutral. How does your body manage this?
    b. With the knowledge about the pH value of your body, how can you support your body to remain healthy?

pH value paper strips

In addition to the simulation students could use pH paper strips to measure the acidity of fluids. It becomes particularly interesting if the fluids you use can be tasted. Students can describe the taste they experience. Use for example coca cola or other fizzy drinks, fruit juice, tea, milk, coffee, water. This real life experiment makes it possible to neutralise an acid/basic fluid using other chemicals, for example by adding bicarbonate (baking soda) to an acidic fluid.

battery hydrometer

Another interesting tool is a battery gravity hydrometer, which actually measures the acidity (pH value) of the battery acid. You could also say that it measures the gravity of the battery fluid. Together with a Volt meter it is used to check if the battery is charged and in good condition If your battery is fully charged the pH value should be near 1.28. If the battery is discharged, the pH value will be near 1.14. The battery hydrometer only measures accurate with pH values around 1.2. So is useless to measure pH values over 2.

More PHET simulations. See also Balancing Act, The moving man, Energy skate park, and Density and Buoyancy.

 Purchase  Free
 Hardware  PC, iPad
 Requirements  browser

Gossip Simulation

DiScoro writes about inquiry-based learning, digital resources, and ways to encourage higher-order thinking. We focus on STEM education and the use of technology.

The Gossip Simulation shows how fast gossip spreads through a group of a hundred people. The simulation enables the user to change the number of people that start to spread a message. Besides the variable number of initial processes (= number of people) there is the variable message loss. The value behind message loss can be attributed to different factors. It could for example be based on the percentage of the people that is not likely to pass on the message.

After the students have familiarised themselves a little with the simulation, you as a teacher could discuss what (other) reasons may lie behind the variable message loss.
The value will be different when the message is a secret and when people are being asked to keep the secret, than when the message contains interesting but harmless information. The value of message loss will also vary in different groups . Some people may be too busy, ill, travelling and are therefore not communicating intensively within the group for a while. There are more factors that could influence the value of message loss.

To explore the simulation students could be asked technical/mathematical questions such as:

  • How many rounds does it take before everyone has got the message with x processes and a message loss of y?
  • Why is the outcome not exactly the same if you run the program several times with the same values for the variables?
  • Can you calculated/estimate the amount of rounds it takes? Explain how and what you did?
  • How could you extrapolate to a thousand people, or to the whole population?

The simulation could be used to discuss group behaviour in real life and on social media. Also topics related to safety/security systems based on communication could be discussed. Warnings about oncoming disasters (tyfoon, floods, earthquakes, pollution etc.) and messages related to evacuations need to reach as many people in a short timespan.

Additional questions for students could be:

  • Considering different scenarios, what could the rounds represent? (minutes, hours, days, weeks ….)
  • When is rounds more likely to be days than minutes?
  • If you want to prevent a message to spread on Facebook, how could you prevent or stop this?
  • What else could this model represent? (spread of warning, spread of a disease, spread of a product, ….)
  • Could you come up with a better name for the simulation.
  • If the police wishes to spread a warning as fast as possible, how could they best go about it?
  • In what way could you use this model to visualise a disease from spreading too fast?

Proposed age group: grade 5-10.

 Purchase  Free
 Hardware  PC, iPad
 Requirements  Browser

Simulation: Diversity

DiScoro writes about inquiry-based learning, digital resources, and ways to encourage higher-order thinking. We focus on STEM education and the use of technology.


This blog is about two simulations based on the same concept namely Thomas Schelling’s Model of Segregation. The model tries to explain social phenomena and shows for example how difficult is it to build and sustain a diverse community. Schelling tries to explain when and why ghetto forming takes place and under which conditions this can be prevented or even reversed.
In other words, people with shared identities tend to cluster/group together. In most classes boys and girls form their own groups.

The first simulation by Frank McCown is named Schelling’s Model of Segregation. The second is by Vi Hart and Nicky Case and named Parable of the Polygons. The two simulations have different interfaces. Both simulations use two groups. The first simulation has four variables (and a interval timer) whereas the Parable of the Polygons offers different simulations for different variables.

The simulation by Frank McCown can be found if you scroll down on the page. The simulation generates a multitude of questions that can be explored.

    • When do communities remain diverse?
    • When and why does clustering take place even if people are relatively tolerant and open-minded?
    • Can segregated communities be tolerant?
    • Under what circumstances does segregation happen and why?
    • How can a segregated community become diverse?

The Parable of the Polygons contains a group of simulations and uses scaffolding to explore the concept. Contrary to Mc Cown’s simulation the Parable of the Polygons visualise if people are happy or not. Additionally the user can move ONE person and see what happens. The last simulation is a particular interesting one.


The Parable of the Polygons could be used as inspiration for the teacher. However, in our opinion the degree of scaffolding will limit the curiosity, thinking and reasoning by the students themselves.

As teachers we have to be careful how to introduce the simulation and how to discuss the issues. Minority groups in class can easily feel uncomfortable. It is up to the teacher to choose the context and vocabulary that suits the class. As you may have observed have we tried to use the word diversity instead of segregation.

Additionally, the simulations can be used by policy makers, but also by students in relation with religion, geography/demography. It has been known in chemistry that seperate molecules and molecules in small quantities react differently than in mass. The same can be observed with people. Individual people can be tolerant and open-minded, but the large group will nevertheless become clustered under certain conditions.


 Purchase  Free
 Hardware  PC, iPad
 Requirements  Browser

FlaskFiller simulation

glazenFlaskFiller, or rather GlassFiller, is a simulation which enables teachers and students to experiment with and reason about the relationship between the shape of a glass, and the change in speed while filling it up (time vs height of the liquid in the glass).


The simulation program enables the user to

  • Select the horizontal axis’ quantity, which is one of height, time, volume, or rising speed.
  • Select the vertical axis’ quantity, which is one of height, time, volume, or rising speed.

Note that you can select the same quantity for both axes, which can make for an interesting topic of discussion. See some screenshots below.

This slideshow requires JavaScript.

Read the information about the simulation and how to use it on FaskFiller Education.
Read the Research done on FlaskFiller software used with grade 5 pupils.

The simulation has been used with grade 5 pupils in a one-to-one setting. When using this simulation in class you might want to use a hands-on experiment first, whereby you use a measuring cup to fill up glasses with different shapes. Let the pupils measure, observe and reason about what is happening with the different glasses.

Afterwards let the pupils experiment with the simulation based on clear questions/tasks. Students should be encouraged to record their findings and discoveries on a worksheet.
Most grade 5 pupils understand the principle of instantaneous speed, but lack the vocabulary. After experimenting in small groups, you could start the simulation on your SmartBoard and discuss the findings. Here the pupils will learn to extend their vocabulary and express what they see and think. Vocabulary: (rising)speed, volume, height, shape, cola-flesjetime, timelap, decrease/increase in speed of height of liquid visible in the graph.
After experimenting and discussion, pupils should for example be able to match a glass (or bottle) with a graph and vice versa.

The simulation can be used from grade 5 up to grade 10 depending on the tasks given.

The simulation program is available online as an HTML file, but can also be downloaded for off-line use.

 Purchase  Free
 Hardware  PC
 Requirements  browser

Simulation game: Fishbanks

overfishing_500Fishbanks – a Renewable Resource Management Game is a simulation program and management game from MIT. The game targets the dilemmas surrounding the exploitation of natural resources, such as fish, clean water, fresh air. These resources are not owned by anybody, yet can easily be depleted by some big industries. This is also know as The Tragedy of the Commons.

The game is about subject areas such as: economy, management, resource management, and environmental studies.

You can try out and viw part of the Fishbanks simulation program without registration. Educational institutes can use the simulation for free after registration (administrator).

Below a introductory video of the previous version of the game on The Tradegy of the Commons.

The game is suitable for higher education classes and possibly in grade 11 and 12.

 Purchase  Free for educational institutes
 Hardware  PC
 Requirements  browser

Climate change simulations

On October 4th 2016 the EU has signed the  global Paris Agreement to reduce greenhouse-gas emissions. The agreement sets out a global action plan to put the world on track to avoid dangerous climate change by limiting global warming to well below 2°C.

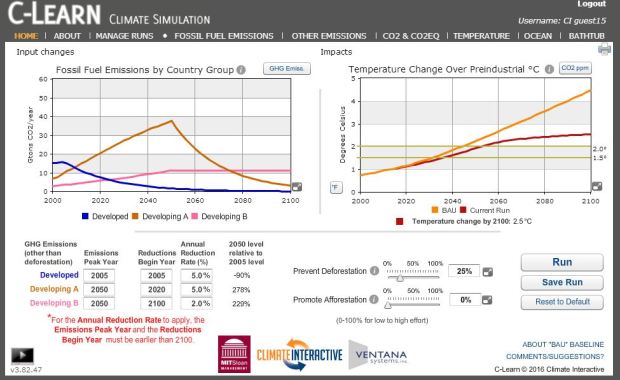
Climate change and clean energy transition are complex challenges. The simulations of Climate Interactive enable you to simulate the many factors and see the result of policies. It is quite reveling and insightfull to see how much reducation in CO2 emmissions is required to minimize the temperature change to 2 degrees Celcius.
C-Learn simulation

C-Learn, C-Roads and EN-Roads are three simulations from Climate Interactive organization, based on systems dynamics modeling from MIT.

The simulations enable teachers, lecturers and students and people in general to see connections, play out scenarios, and see what works to address the biggest challenges we face: climate change and clean energy.

The simulations enable you to set up and compare many What if scenarios. The Climate Interactive website offers tutorial videos on how to use the tools.

  • C-Learn is the simple version of C-Roads and available online
  • C-Roads is the Climate simulation which has to be downloaded
  • EN-Roards is the simulation on Energy transition and climate goals

Target group: policy makers, lecturers, university students.
C-Learn can definitely be used at higher secondary level.

 Purchase  Free
 Hardware  iPad, PC
 Requirements  browser
Note: the downloads give security warnings.